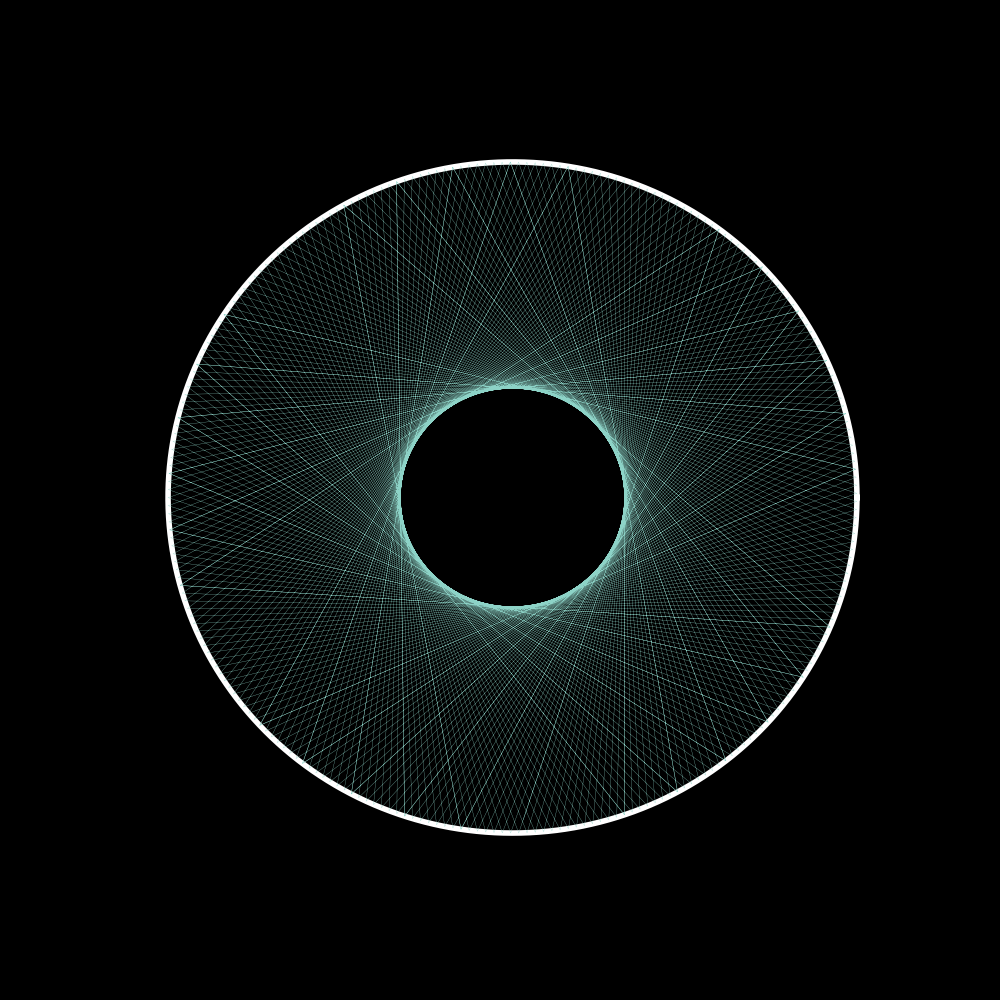
this article is to record how I create a image when a ball bounces insides a bigger circle,can copy the below code to get a image directly.
import matplotlib.pyplot as plt
import numpy as np

def solve_quadratic_equation(a, b, c):
    delta = b**2 - 4 * a * c
    if delta > 0:
        x1 = (-b + (delta**0.5)) / (2 * a)
        x2 = (-b - (delta**0.5)) / (2 * a)
        y1 = curve(x1)
        y2 = curve(x2)
        return (x1, y1), (x2, y2)
    elif delta == 0:
        x1 = (-b + (delta**0.5)) / (2 * a)
        y1 = curve(x1)
        return (x1, y1), (x1, y1)
    else:
        return False


# Define the curve function
def curve(x):
    return np.sqrt(16 - (x**2))


def curve_y(y):
    return np.sqrt(16 - (y**2))


def normal_slope(x, y):
    return np.array([x, y])


def get_incident_point(oldPosition, newPosition):
    x = -100
    y = -100
    vector = np.subtract(newPosition, oldPosition)
    xRange = [min(oldPosition[0], newPosition[0]), max(oldPosition[0], newPosition[0])]
    yRange = [min(oldPosition[1], newPosition[1]), max(oldPosition[1], newPosition[1])]

    if xRange[0] == xRange[1]:
        x = xRange[0]
        tmpY = curve(x)

        if tmpY >= yRange[0] and tmpY <= yRange[1]:
            y = tmpY
        else:
            y = -tmpY

        return (x, y)
    if yRange[0] == yRange[1]:
        y = yRange[0]
        tmpX = curve_y(y)
        if tmpX >= xRange[0] and tmpX <= xRange[1]:
            x = tmpX
        else:
            x = -tmpX

    ###y = kx + t
    k = round(vector[1] / vector[0], 6)
    t = oldPosition[1] - (k * oldPosition[0])

    ### x**2 -kx -b- 3 = 0
    a = 1 + (k**2)
    b = 2 * k * t
    c = (t**2) - 16
    delta = b**2 - 4 * a * c
    if delta >= 0:
        (x1, y1), (x2, y2) = solve_quadratic_equation(a, b, c)
        point_ = [ [x1, x1*k+t],  [x2, x2*k+t] ]

        if round(np.linalg.norm(np.subtract(oldPosition, point_[0])), 12) <= round(np.linalg.norm(np.subtract(oldPosition, point_[1])), 12):
            x = point_[0][0]
            y = point_[0][1]
        else:
            x = point_[1][0]
            y = point_[1][1]
    else:
        print("something wrong, didn't get the incident point")
        return False
    #print(x, y)
    return (x, y)


def normalize(v):
    norm = np.linalg.norm(v)
    if norm == 0:
        return v
    return v / norm


def getCurvePointByX(x, closePoint):
    tmpY = round(np.sqrt(16 - (x**2)), 12)
    x1, y1 = x, tmpY
    x2, y2 = x, -tmpY
    if round(np.linalg.norm(np.subtract(closePoint, [x1, y1])), 12) <= round(
        np.linalg.norm(np.subtract(closePoint, [x2, y2])), 12
    ):
        return y1
    else:
        return y2


rayPoints = [[[1.3, 0]]]  ###would be many rays
rayVector = [[0, -0.1]]  ###would be many vectors
countReflection = 0
indexFrame = 1
index = 0
while True:
    currentPoint = rayPoints[index][-1]
    nextPoint = np.add(currentPoint, rayVector[index])
    # print(nextPoint)
    nextPointX = round(nextPoint[0], 12)
    nextPointY = round(nextPoint[1], 12)

    distance = nextPointX**2 + nextPointY**2
    gap = round(distance, 12) - 16
    if indexFrame > 22000:
        break
    indexFrame = indexFrame + 1

    # print(round(nextPointY,6), curve(nextPointX),">>", gap)
    if gap < 0:  ## keep vector, and add one point
        rayPoints[index].append(nextPoint)
        # print("passed", nextPoint, currentPoint, curvePoint)

    elif gap >= 0:  ##need to change vector and add one point
        x, y = get_incident_point(nextPoint, currentPoint)
        curvePoint = [x, getCurvePointByX(x, currentPoint)]
        # print("hello", indexFrame)
        # print("down to curve", nextPoint, currentPoint, curvePoint)
        normal_vector = normal_slope(x, y)
        normal_vector = normalize(normal_vector)
        # print(">>>>>",x, round(x,5), normal_vector, rayVector[index])
        rayVector[index] = (
            rayVector[index]
            - 2 * np.dot(rayVector[index], normal_vector) * normal_vector
        )
        # print(">>>>>",x, round(x,5), normal_vector, rayVector[index])
        rayPoints[index].append([x, y])


# print(rayPoints)
xRay = []
yRay = []
"""
for index in range(len(rayPoints)):
  xRay.append(rayPoints[index][0])
  yRay.append(rayPoints[index][1])
"""
for x in rayPoints[index]:
    xRay.append(x[0])
    yRay.append(x[1])

theta = np.linspace(0, 2 * np.pi, 10000)
xRange = 4 * np.cos(theta)
yRange = 4 * np.sin(theta)
##y = x**2 - 3, k = 2x
viewRangeX = [-4.5, 4.5]
viewRangeY = [-4.5, 4.5]
plt.style.use("dark_background")
fig, ax = plt.subplots(figsize=[5, 5])
ax.set_xlim(viewRangeX[0], viewRangeX[1])
ax.set_ylim(viewRangeY[0], viewRangeY[1])
plt.axis("off")
ax.plot(xRange, yRange, linewidth=2, color="w")
ax.plot(xRay, yRay, linewidth=0.1)
plt.savefig("imgae4.png", dpi=200)
plt.show()