This article records how I created a Hypotrochoid video using matplotlib.
the video is requiring below a few items.
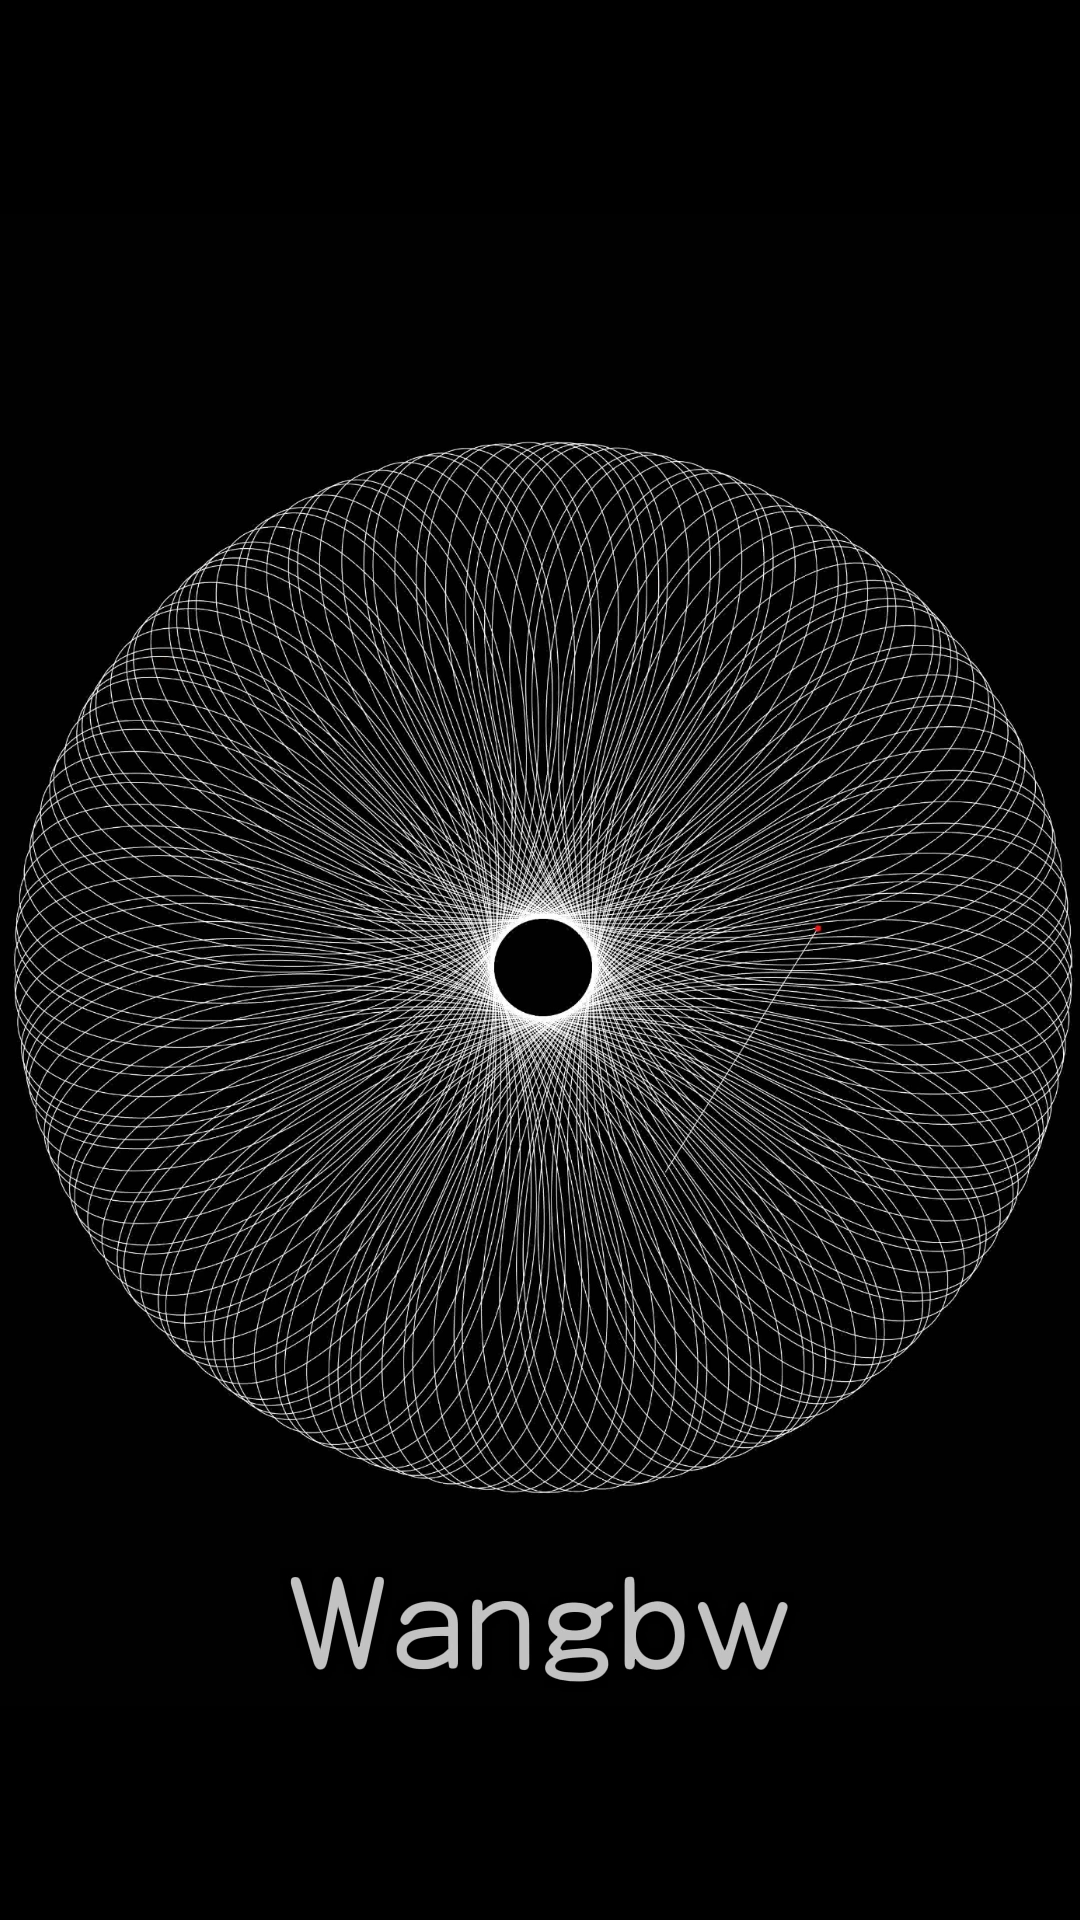
- need to explain the two dot postion equation. could refer to the link for explanation, https://juejin.cn/post/7012532213187084296
- radius ratio is sqrt(2), hence they never connected.
import matplotlib.pyplot as plt
from mpl_toolkits.axes_grid1.inset_locator import zoomed_inset_axes
from mpl_toolkits.axes_grid1.inset_locator import mark_inset
from scipy import misc
from numpy import linspace
import numpy as np
from celluloid import Camera
from matplotlib import animation
import math

R =  3 * np.sqrt(2)
r = 3
d = r/2
arrTheta = np.linspace(0, 2*408*np.pi, 800000)

xCenter = (R-r) * np.cos(arrTheta)
yCenter = (R-r) * np.sin(arrTheta)

xReal = (R-r) * np.cos(arrTheta) + d*np.cos( (R-r)/r * arrTheta)
yReal = (R-r) * np.sin(arrTheta) - d*np.sin( (R-r)/r * arrTheta)
plt.style.use("dark_background")
fig, ax = plt.subplots(figsize=[5, 5])

index = 10
frameIndex = 1
m1 = 56900
m2 = 331400
m3 = 800000
mList = [0,56900, 331400, 800000]
rList = [8000,7000,6000,5000,4000,3000,2000,1000,800,600,400,200]
rList = np.divide(rList, 2)
tList = [800, 700, 600, 500, 400, 300, 200, 100, 50, 30, 20, 10]
tList = np.divide(tList, 2)
while True:
    plt.axis('off')
    x = xReal[:index]  ###in pycharm you need to change the index into int(index).
    y = yReal[:index]  ###in pycharm you need to change the index into int(index).
    xc = xCenter[index]###in pycharm you need to change the index into int(index).
    yc = yCenter[index]###in pycharm you need to change the index into int(index).
    xd = xReal[index]  ###in pycharm you need to change the index into int(index).
    yd = yReal[index]  ###in pycharm you need to change the index into int(index).

    ax.set_xlim(-3, 3) ###this is used to control appearance area, could use this to zoom or move visualization center.
    ax.set_ylim(-3, 3)

    t = 1000
    for m in mList:
        for tt in range(len(rList)):
            if index>=m-rList[tt] and index<=m+rList[tt]:
                t = tList[tt]
    index = index+t

    ax.plot(x, y, linewidth=0.2,color='w')
    ax.plot([xc,xd ],[yc,yd], linewidth=0.2,color='w')
    ax.plot([xd],[yd],'ro',markersize = 0.5)
    plt.savefig("img4/img{}.png".format(frameIndex),dpi=600)
    plt.cla()
    if index>810000-1: #800000+10000
        break
    frameIndex = frameIndex + 1
plt.show()