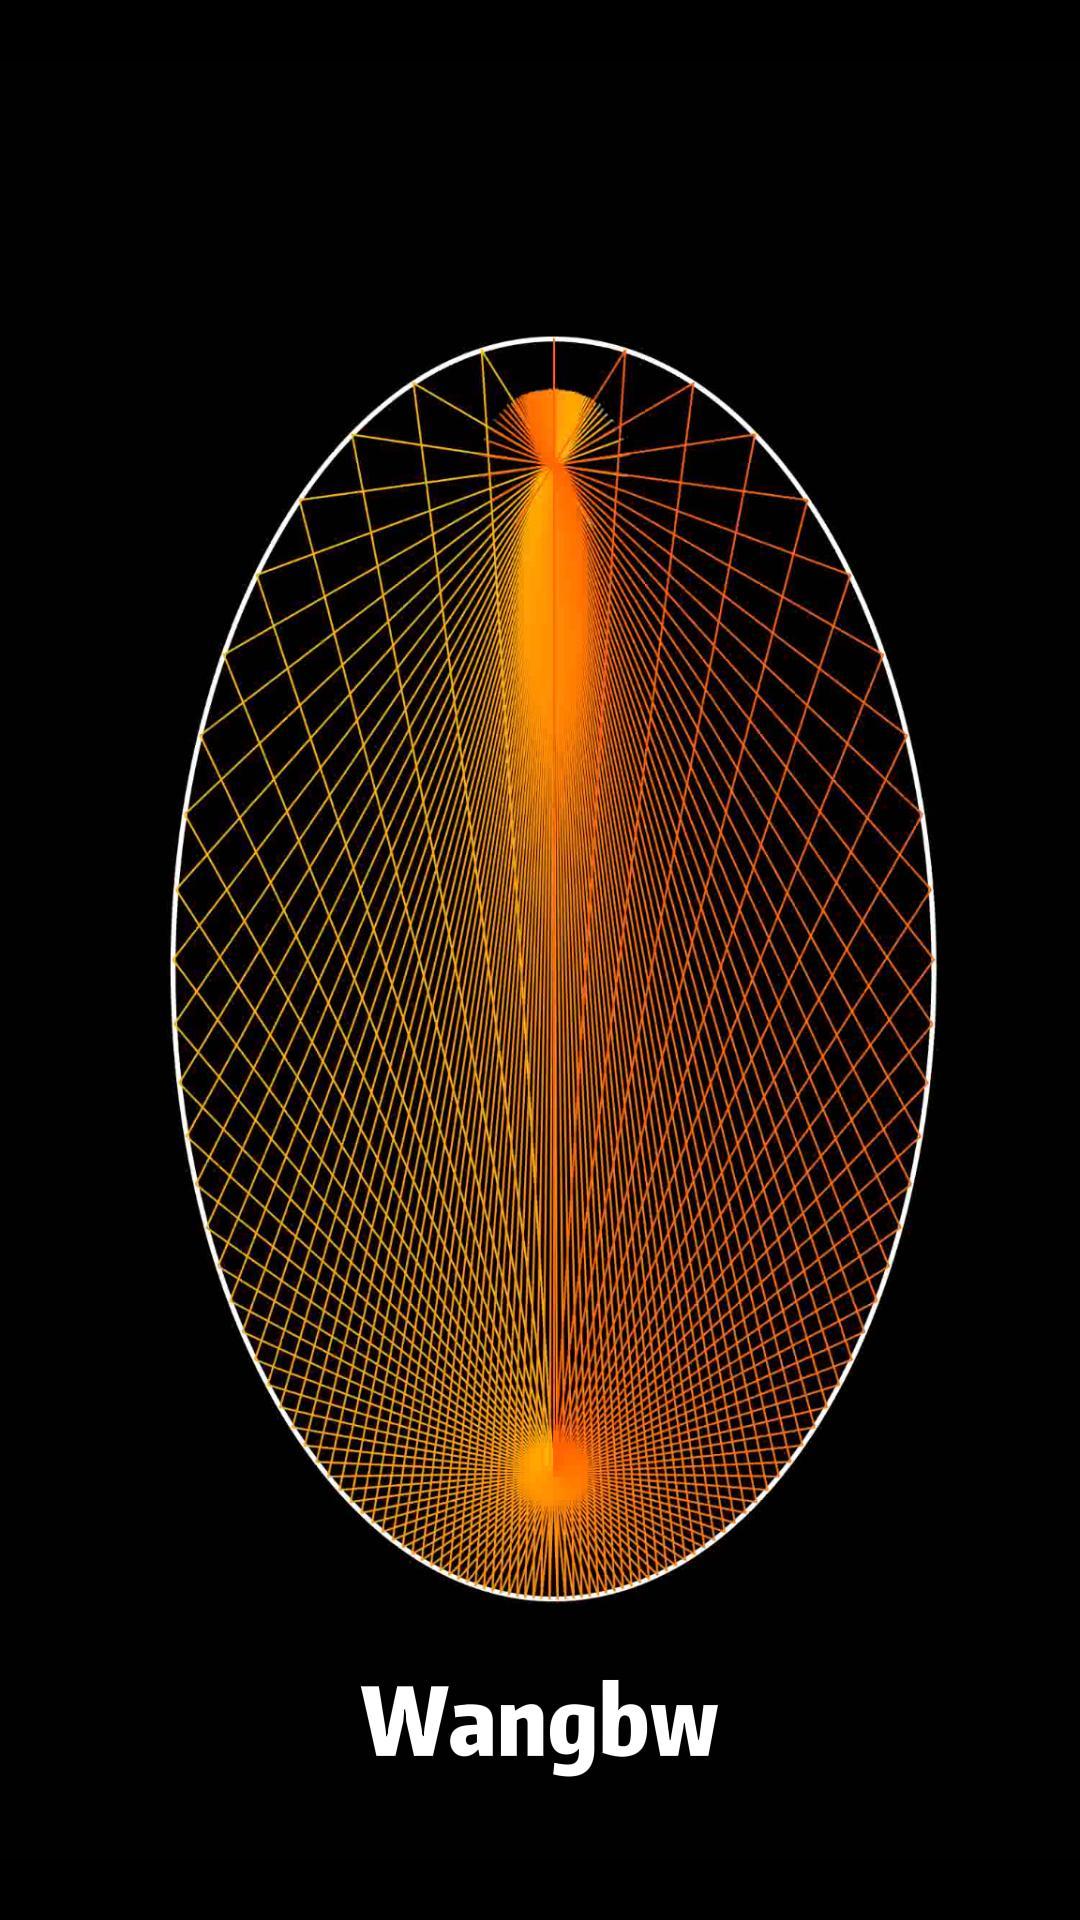
this article is to record how I create the simulation that rays gets reflection insides Ellipse.
import matplotlib.pyplot as plt
import numpy as np

from manim import *
from os import system
import random
import numpy as np
from colour import Color


## define below two functions.
def hex_to_RGB(hex_str):
    """ #FFFFFF -> [255,255,255]"""
    #Pass 16 to the integer function for change of base
    return [int(hex_str[i:i+2], 16) for i in range(1,6,2)]

def get_color_gradient(c1, c2, n):
    """
    Given two hex colors, returns a color gradient
    with n colors.
    """
    assert n > 1
    c1_rgb = np.array(hex_to_RGB(c1))/255
    c2_rgb = np.array(hex_to_RGB(c2))/255
    mix_pcts = [x/(n-1) for x in range(n)]
    rgb_colors = [((1-mix)*c1_rgb + (mix*c2_rgb)) for mix in mix_pcts]
    return [Color("#" + "".join([format(int(round(val*255)), "02x") for val in item])) for item in rgb_colors]


def solve_quadratic_equation(a, b, c):
    delta = b**2 - 4 * a * c
    if delta >= 0:
        x1 = (-b + (delta**0.5)) / (2 * a)
        x2 = (-b - (delta**0.5)) / (2 * a)
        return x1, x2
    else:
        return False


# Define the curve function
def curve(x, xt, yt):  ##to get y on the track
    return np.sqrt(yt * yt * (1 - (x**2) / (xt * xt)))


def curve_y(y, xt, yt):
    return np.sqrt(xt * xt * (1 - (y**2) / (yt * yt)))


def tangent_slope(x, y, xt, yt):
    m = -(yt * yt * x) / (xt * xt * y)
    return np.array([1, m])


def normal_slope(x, y, xt, yt):
    mn = (xt * xt * y) / (yt * yt * x)
    return np.array([1, mn])


def get_incident_point(oldPosition, newPosition, xt, yt):
    x = -100
    y = -100
    vector = np.subtract(newPosition, oldPosition)
    xRange = [min(oldPosition[0], newPosition[0]), max(oldPosition[0], newPosition[0])]
    yRange = [min(oldPosition[1], newPosition[1]), max(oldPosition[1], newPosition[1])]

    if xRange[0] == xRange[1]:
        x = xRange[0]
        tmpY = curve(x, xt, yt)  ###>0
        if tmpY >= yRange[0] and tmpY <= yRange[1]:  ##make sure it is in the range.
            y = tmpY
        else:
            y = -tmpY
        return (x, y)
    if yRange[0] == yRange[1]:
        y = yRange[0]
        tmpX = curve_y(y, xt, yt)
        if tmpX >= xRange[0] and tmpX <= xRange[1]:
            x = tmpX
        else:
            x = -tmpX
        return (x, y)

    """
    A = a*a*k*k + b*b
    B = 2*a*a*k*t
    C = a*a*t*t - a*a*b*b
    """
    ###y = kx + t
    k = round(vector[1] / vector[0], 6)
    t = oldPosition[1] - (k * oldPosition[0])

    ### x**2 -kx -b- 3 = 0
    a = xt * xt * k * k + yt * yt
    b = 2 * xt * xt * k * t
    c = xt * xt * t * t - xt * xt * yt * yt
    delta = b**2 - 4 * a * c
    if delta >= 0:
        x1, x2 = solve_quadratic_equation(a, b, c)
        # print("k=",k, "b=",b, "t=",t, "delta=",delta,"x y =", (x1,y1), (x2,y2))
        point_ = [[x1, x1 * k + t], [x2, x2 * k + t]]

        if round(np.linalg.norm(np.subtract(oldPosition, point_[0])), 12) <= round(
            np.linalg.norm(np.subtract(oldPosition, point_[1])), 12
        ):
            x = point_[0][0]
            y = point_[0][1]
        else:
            x = point_[1][0]
            y = point_[1][1]
    else:
        print("something wrong, didn't get the incident point")
        return False

    return (x, y)


def normalize(v):
    norm = np.linalg.norm(v)
    if norm == 0:
        return v
    return v / norm


xt = 3
yt = 5
C = np.sqrt(yt * yt - xt * xt)  ####2*yt
f1 = [0, C]
f2 = [0, -C]

rayCounts = 100


###create Gradients colors. then use colorssss[xxx] in Manim or colorssss[xxx].get_hex() in matplotlib.
tmp = ["#ffbe0b", "#fb5607"]

bases = []
for t in range(1):
    for c in tmp:
       bases.append(c)
colorssss = []
for index in range(len(bases)):
    if index < len(bases) - 1:
       start = bases[index]
       end = bases[index + 1]
       colors = get_color_gradient(start, end, rayCounts)
       for c in colors:
           colorssss.append(c)
print(len(colorssss))


vectorInitial = np.linspace(np.pi/2, 2 * np.pi+np.pi/2, rayCounts)
rayPoints = [[] for _ in range(rayCounts)]
xPositions = np.linspace(-2.8, 2.8, rayCounts)
for index in range(len(xPositions)):
    rayPoints[index].append([0, -C])
    rayVector = [[0.020 * np.cos(_), 0.020 * np.sin(_)] for _ in vectorInitial]
# rayPoints = [[[1.6, 0]]]  ###would be many rays
# rayVector = [[0, -0.09]]  ###would be many vectors
indexFrame = 1
totalFrame = 1000
index = 0

collisions = [[] for _ in range(rayCounts)]
while True:
    for index in range(rayCounts):
        currentPoint = rayPoints[index][-1]
        nextPoint = np.add(currentPoint, rayVector[index])

        flag = True
        distance = np.linalg.norm(np.subtract(nextPoint, f1)) + np.linalg.norm(
            np.subtract(nextPoint, f2)
        )
        if distance >= 2 * yt:
            flag = False

        if flag:  ## keep vector, and add one point
            rayPoints[index].append(nextPoint)
            collisions[index].append(0)
        else:  ##need to change vector and add one point
            x, y = get_incident_point(nextPoint, currentPoint, xt, yt)
            curvePoint = [x, y]
            collisions[index].append(1)
            # print("down to curve", indexFrame,distance, nextPoint, currentPoint, curvePoint)
            normal_vector = normal_slope(x, y, xt, yt)
            normal_vector = normalize(normal_vector)
            # print(">>>>>",x, round(x,5), normal_vector, rayVector[index])
            rayVector[index] = (
                    rayVector[index]
                    - 2 * np.dot(rayVector[index], normal_vector) * normal_vector
            )
            # print(">>>>>",x, round(x,5), normal_vector, rayVector[index])
            rayPoints[index].append([x, y])

    indexFrame = indexFrame + 1
    if indexFrame > totalFrame:
        break


plt.style.use("dark_background")
fig, ax = plt.subplots(figsize=[xt, yt])

theta = np.linspace(0, 2 * np.pi, 10000)
xRange = xt * np.cos(theta)
yRange = yt * np.sin(theta)

viewRangeX = [-xt, xt]
viewRangeY = [-yt, yt]

for index in range(totalFrame):
    if index>=0:
        # print(rayPoints)
        xRay = [[] for _ in range(rayCounts)]
        yRay = [[] for _ in range(rayCounts)]

        for ttt in range(rayCounts):
            for x in rayPoints[ttt][: (index + 1)]:
                xRay[ttt].append(x[0])
                yRay[ttt].append(x[1])

        ##y = x**2 - 3, k = 2x
        # ax.set_xlim(viewRangeX[0], viewRangeX[1])
        # ax.set_ylim(viewRangeY[0], viewRangeY[1])

        plt.axis("off")
        ax.plot(xRange, yRange, linewidth=1, color="w")
        for rayIndex in range(rayCounts):
            ax.plot(
                xRay[rayIndex], yRay[rayIndex], "-", linewidth=0.4, color=colorssss[rayIndex].get_hex(), markersize=2
            )
        # ax.plot([xRay[rayIndex][-1]], [yRay[rayIndex][-1]], "-", linewidth=2, color="r")
        plt.savefig("img{}.png".format(index + 1), dpi=500)
        plt.cla()

print("over")