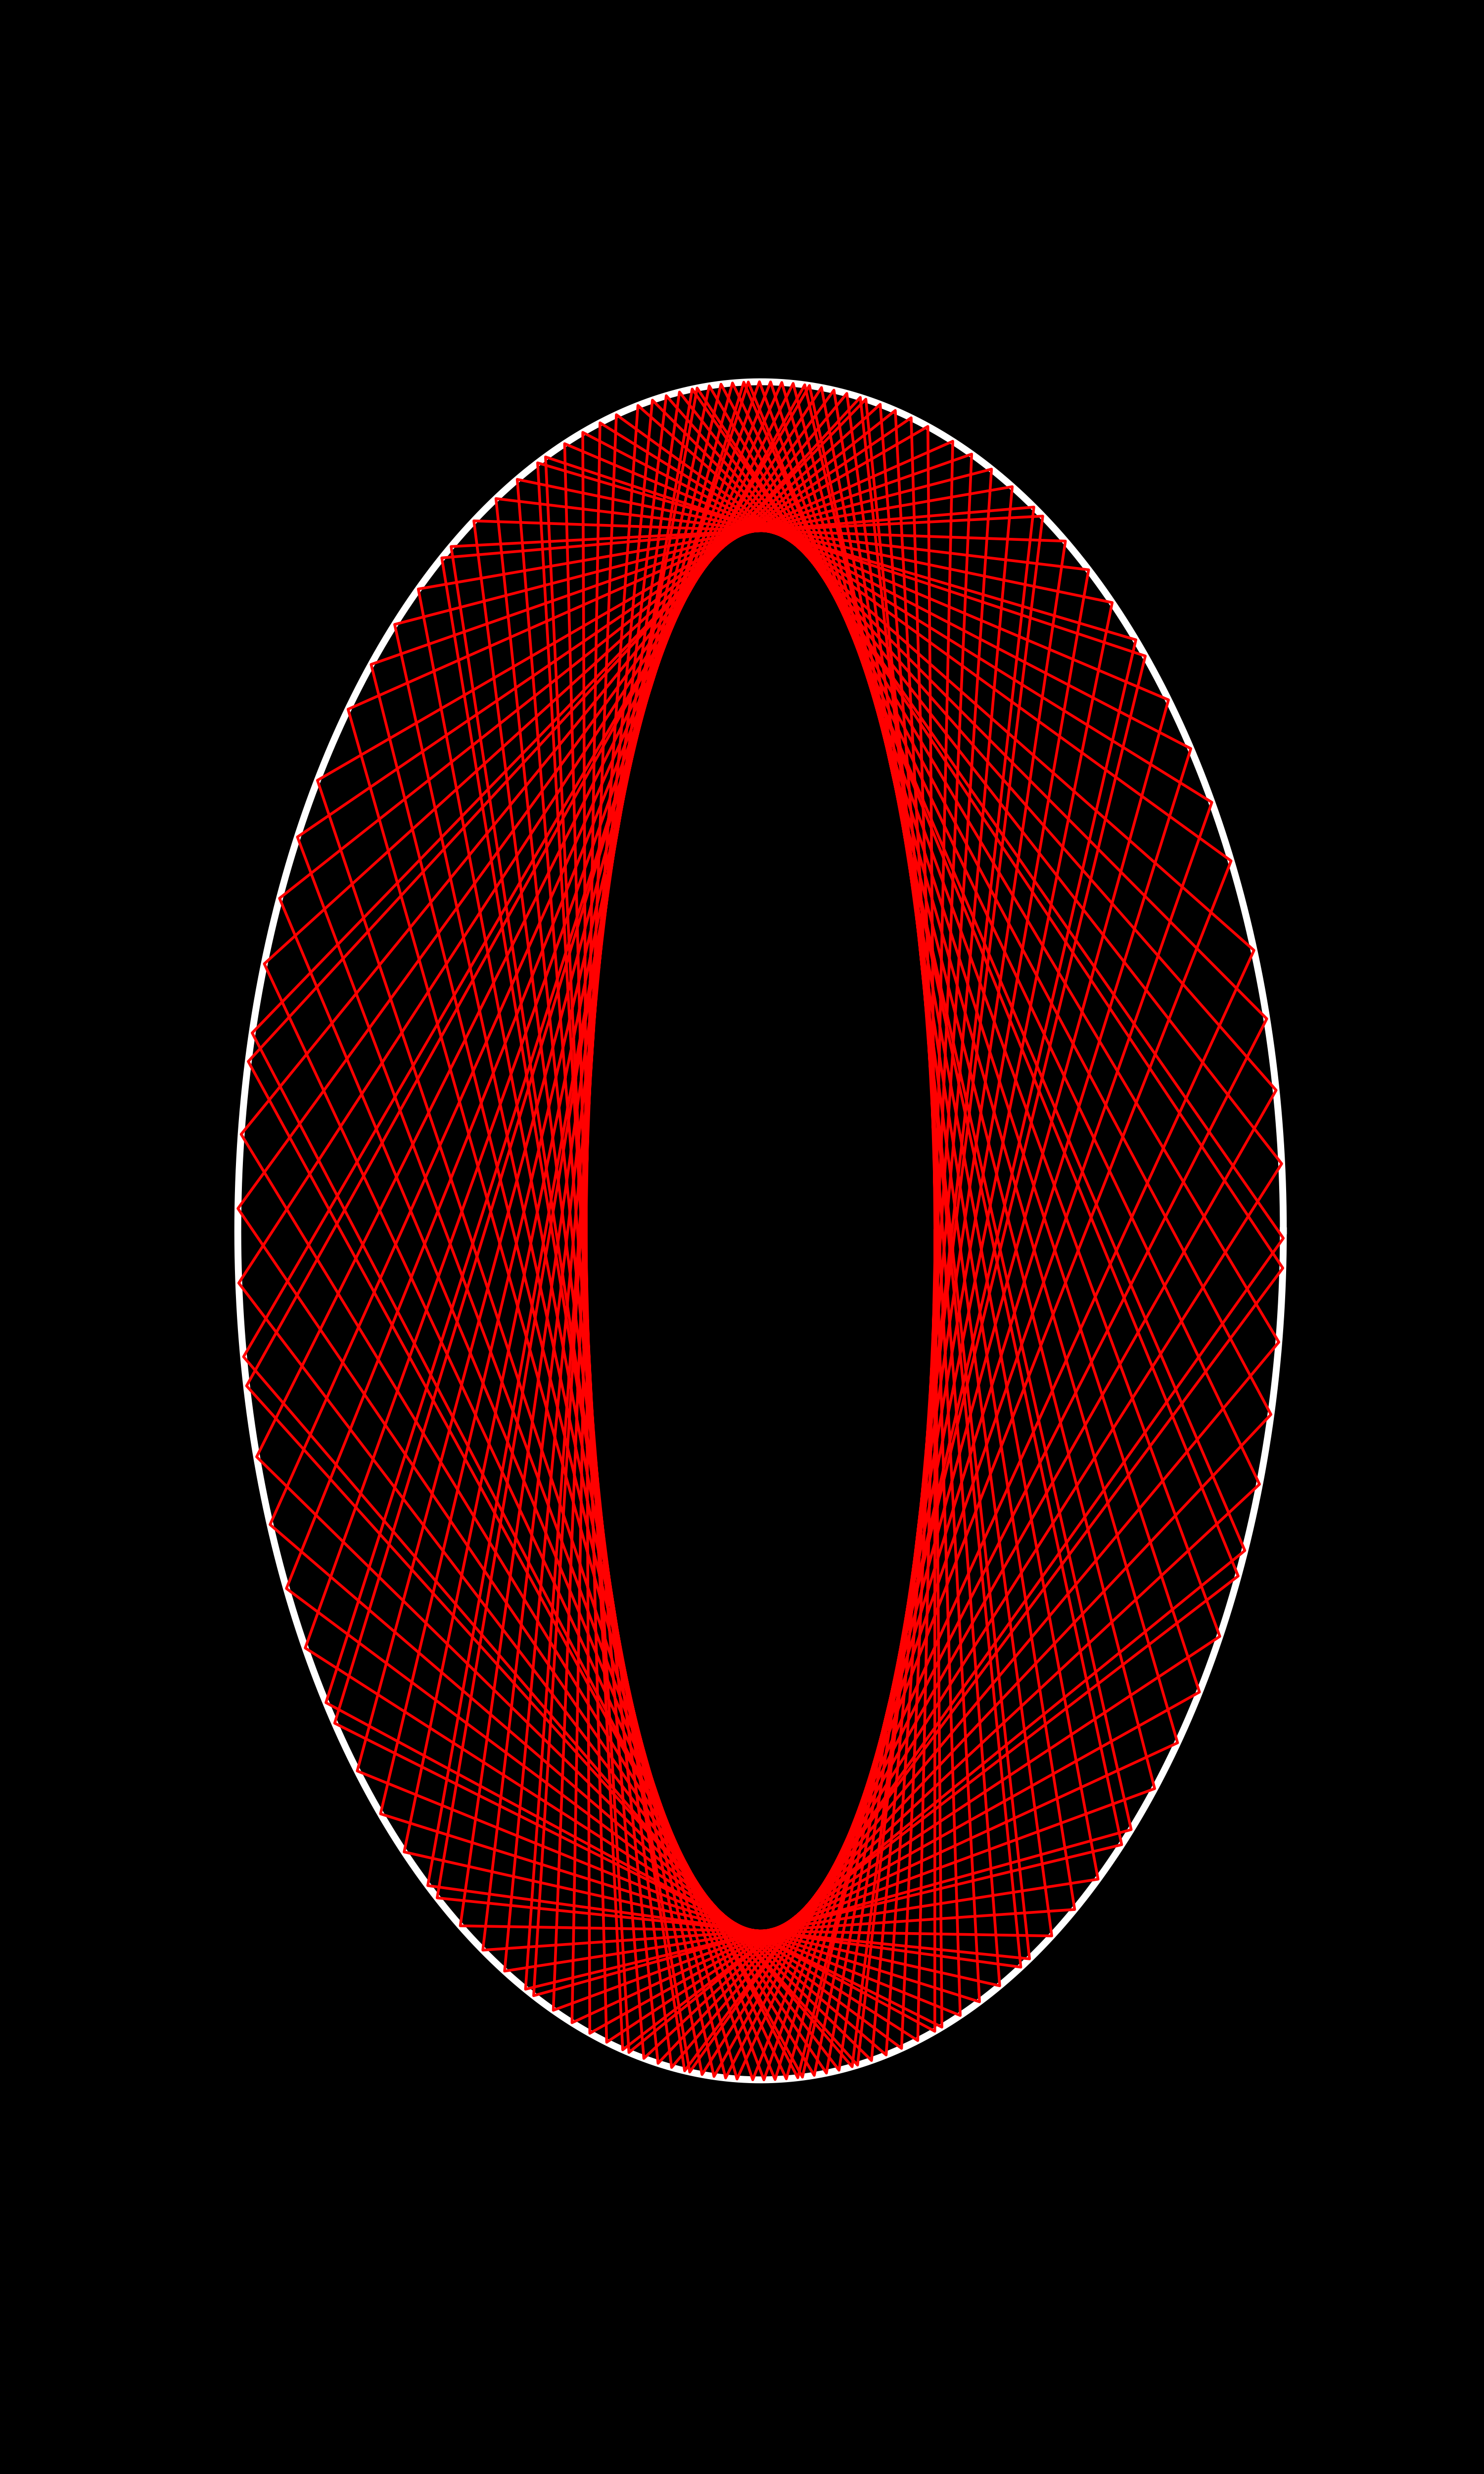
this article is to record how I create a image when a ball bounces insides a bigger ellipse,can copy the below code to get a image directly. but this post doesn’t take care the overlap, so it won’t be the best accurate.
import matplotlib.pyplot as plt
import numpy as np

def solve_quadratic_equation(a, b, c):
    delta = b**2 - 4 * a * c
    if delta > 0:
        x1 = (-b + (delta**0.5)) / (2 * a)
        x2 = (-b - (delta**0.5)) / (2 * a)
        return x1, x2
    elif delta == 0:
        x1 = (-b + (delta**0.5)) / (2 * a)
        return x1, x1
    else:
        return False


# Define the curve function
def curve(x, xt, yt):  ##to get y on the track
    return np.sqrt(yt * yt * (1 - (x**2) / (xt * xt)))


def curve_y(y, xt, yt):
    return np.sqrt(xt * xt * (1 - (y**2) / (yt * yt)))


def tangent_slope(x, y, xt, yt):
    m = -(yt * yt * x) / (xt * xt * y)
    return np.array([1, m])


def normal_slope(x, y, xt, yt):
    mn = (xt * xt * y) / (yt * yt * x)
    return np.array([1, mn])


def get_incident_point(oldPosition, newPosition, xt, yt):
    x = -100
    y = -100
    vector = np.subtract(newPosition, oldPosition)
    xRange = [min(oldPosition[0], newPosition[0]), max(oldPosition[0], newPosition[0])]
    yRange = [min(oldPosition[1], newPosition[1]), max(oldPosition[1], newPosition[1])]

    if xRange[0] == xRange[1]:
        x = xRange[0]
        tmpY = curve(x, xt, yt)  ###>0
        if tmpY >= yRange[0] and tmpY <= yRange[1]:  ##make sure it is in the range.
            y = tmpY
        else:
            y = -tmpY
        return (x, y)
    if yRange[0] == yRange[1]:
        y = yRange[0]
        tmpX = curve_y(y, xt, yt)
        if tmpX >= xRange[0] and tmpX <= xRange[1]:
            x = tmpX
        else:
            x = -tmpX
        return (x, y)

    """
    A = a*a*k*k + b*b
    B = 2*a*a*k*t
    C = a*a*t*t - a*a*b*b
    """
    ###y = kx + t
    k = round(vector[1] / vector[0], 6)
    t = oldPosition[1] - (k * oldPosition[0])

    ### x**2 -kx -b- 3 = 0
    a = xt * xt * k * k + yt * yt
    b = 2 * xt * xt * k * t
    c = xt * xt * t * t - xt * xt * yt * yt
    delta = b**2 - 4 * a * c
    if delta >= 0:
        x1, x2 = solve_quadratic_equation(a, b, c)
        # print("k=",k, "b=",b, "t=",t, "delta=",delta,"x y =", (x1,y1), (x2,y2))
        point_ = [[x1, x1 * k + t], [x2, x2 * k + t]]

        if round(np.linalg.norm(np.subtract(oldPosition, point_[0])), 12) <= round(
            np.linalg.norm(np.subtract(oldPosition, point_[1])), 12
        ):
            x = point_[0][0]
            y = point_[0][1]
        else:
            x = point_[1][0]
            y = point_[1][1]
    else:
        print("something wrong, didn't get the incident point")
        return False

    return (x, y)


def normalize(v):
    norm = np.linalg.norm(v)
    if norm == 0:
        return v
    return v / norm


xt = 3
yt = 5

rayPoints = [[[1, 0]]]  ###would be many rays
rayVector = [[0, -0.3]]  ###would be many vectors
indexFrame = 1
totalFrame = 3200
index = 0
C = np.sqrt(yt * yt - xt * xt)  ####2*yt
f1 = [0, C]
f2 = [0, -C]
collisions = []
while True:
    currentPoint = rayPoints[index][-1]
    nextPoint = np.add(currentPoint, rayVector[index])
    # print(nextPoint)
    nextPointX = round(nextPoint[0], 12)
    nextPointY = round(nextPoint[1], 12)

    flag = True
    distance = np.linalg.norm(np.subtract(nextPoint, f1)) + np.linalg.norm(
        np.subtract(nextPoint, f2)
    )
    if distance >= 2 * yt:
        flag = False

    if indexFrame > totalFrame:
        break
    indexFrame = indexFrame + 1

    # print(round(nextPointY,6), curve(nextPointX),">>", gap)
    if flag:  ## keep vector, and add one point
        rayPoints[index].append(nextPoint)
        collisions.append(0)
        # print("passed", nextPoint, currentPoint, curvePoint)
    else:  ##need to change vector and add one point
        x, y = get_incident_point(nextPoint, currentPoint, xt, yt)
        curvePoint = [x, y]
        collisions.append(1)
        # print("down to curve", indexFrame,distance, nextPoint, currentPoint, curvePoint)
        normal_vector = normal_slope(x, y, xt, yt)
        normal_vector = normalize(normal_vector)
        # print(">>>>>",x, round(x,5), normal_vector, rayVector[index])
        rayVector[index] = (
            rayVector[index]
            - 2 * np.dot(rayVector[index], normal_vector) * normal_vector
        )
        # print(">>>>>",x, round(x,5), normal_vector, rayVector[index])
        rayPoints[index].append([x, y])


# print(rayPoints)
xRay = []
yRay = []
for x in rayPoints[index]:
    xRay.append(x[0])
    yRay.append(x[1])

theta = np.linspace(0, 2 * np.pi, 10000)
xRange = xt * np.cos(theta)
yRange = yt * np.sin(theta)
##y = x**2 - 3, k = 2x
viewRangeX = [-4.5, 4.5]
viewRangeY = [-4.5, 4.5]
plt.style.use("dark_background")
fig, ax = plt.subplots(figsize=[xt, yt])
# ax.set_xlim(viewRangeX[0], viewRangeX[1])
# ax.set_ylim(viewRangeY[0], viewRangeY[1])
plt.axis("off")
ax.plot(xRange, yRange, linewidth=1, color="w")
ax.plot(xRay, yRay, "-", linewidth=0.4, color="r", markersize=2)
ax.plot([xRay[-1]], [yRay[-1]], "-", linewidth=2, color="r")
plt.savefig("imgae12.png", dpi=1000)
# plt.show()