below code shows How blender scripting plot a functional curve,
import bpy
from mathutils import Vector
import numpy as np
current_scene = bpy.context.scene
default_cube = current_scene.objects['Cube']
# X, Y, and Z location to set
default_cube.location = (0.0, 0.0, 0.0)
# Set the keyframe with that location, and which frame.
default_cube.keyframe_insert(data_path="location", frame=1)
# do it again
default_cube.location = (3.0, 2.0, 1.0)
# setting it for frame 10
default_cube.keyframe_insert(data_path="location", frame=10)
w = 5
def MakePolyLine(objname, curvename, cList):
curvedata = bpy.data.curves.new(name=curvename, type='CURVE')
curvedata.dimensions = '3D'
objectdata = bpy.data.objects.new(objname, curvedata)
objectdata.location = (0,0,0) #object origin
bpy.context.collection.objects.link(objectdata)
polyline = curvedata.splines.new('NURBS')
polyline.points.add(len(cList)-1)
for num in range(len(cList)):
polyline.points[num].co = (cList[num])+(w,)
polyline.order_u = len(polyline.points)-1
polyline.use_endpoint_u = True
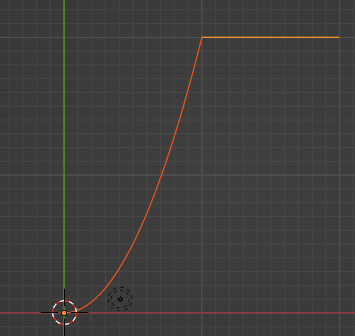
def func(x):
return 0.2 * x**2
xx = np.linspace(0,10,100)
yy = func(xx)
listOfVectors = [(x,y,0) for x,y in zip(xx, yy)]
MakePolyLine("NameOfMyCurveObject", "NameOfMyCurve", listOfVectors)
vectors = []
xArr = np.linspace(10,20, 100)
for x in xArr:
vectors.append((x, 20, 0))
MakePolyLine("Name2", "curveLine2", vectors)