this Article is to record How I create a Mandala pattern Geometry.
import matplotlib.pyplot as plt
import numpy as np
MaxLength = 4.4 ###this is to control size of length
lineWidth = [1, 1.1, 1.0, 0.8]
ViewMaxLength = MaxLength * 1.1
MoveYDown = -1
#sliceCount = 50000
totalFrames = 1000 #total frames
sharp = 4 #the bigger sharp is, the line more sharp
x = np.linspace(-sharp, sharp, totalFrames) #
z = 1 / (1 + np.exp(-x)) * 100000000
zz = [round(_-z[0]) for _ in z] ####ok now use the
sliceCount = zz[-1]
BASE = 1
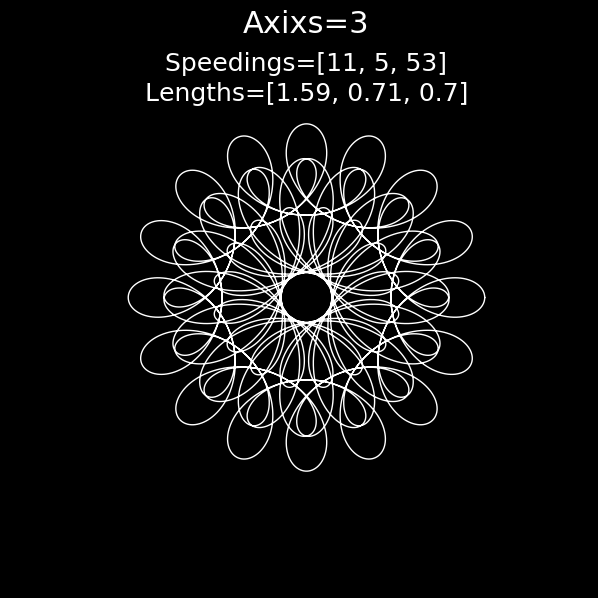
SR_ = [11,5,53]
SRR_= []
DI_ = [-1,1,1] ###this is to control the direction
for index in range(len(SR_)):
SRR_.append(SR_[index] * DI_[index])
###this is to control size of length arrMoving.append()
RSR_ =[np.linspace(0, _ * BASE*np.pi *2, sliceCount) for _ in SR_ ]
LR_ = [1.59,0.71,0.7]
RLR_ = [ round(_ / sum(LR_) * MaxLength,6) for _ in LR_ ]
countPoints = len(SR_)
Points = [[] for _ in range(countPoints)]
"""
dotCenterX.append( rs[index] * np.cos(arrCenter[index]) )
dotCenterY.append( rs[index] * np.sin(arrCenter[index]) )
"""
for index in range(countPoints):
if index == 0:
for pointIndex in range(sliceCount):
#p = (RLR_[index] * np.cos(RSR_[index][pointIndex]), RLR_[index] * np.sin(RSR_[index][pointIndex]) )
p = [RLR_[index] * np.cos(DI_[index] * RSR_[index][pointIndex]), RLR_[index] * np.sin(DI_[index] * RSR_[index][pointIndex]) ]
Points[index].append(p)
else:
for pointIndex in range(sliceCount):
p = np.add( Points[index-1][pointIndex]
,[RLR_[index] * np.cos(DI_[index] * RSR_[index][pointIndex]),
RLR_[index] * np.sin(DI_[index] * RSR_[index][pointIndex])] )
Points[index].append(p)
plt.style.use("dark_background")
fig, ax = plt.subplots(figsize=[ViewMaxLength, ViewMaxLength*1.7777])
viewRangeX = np.array([-ViewMaxLength,ViewMaxLength])
viewRangeY = np.array([-ViewMaxLength*1.7777,ViewMaxLength*1.7777])
ax.set_xlim(viewRangeX[0], viewRangeX[1])
ax.set_ylim(viewRangeY[0], viewRangeY[1])
plt.axis('off')
lastX = []
lastY = []
for x in Points[-1]:
lastX.append(x[0])
lastY.append(x[1]+MoveYDown)
plt.text(0, ViewMaxLength*1.4, 'N={}'.format(countPoints), fontsize = 22,horizontalalignment='center',)
plt.text(0, ViewMaxLength*1.2, 'Speedings={}'.format(SRR_), fontsize = 14,horizontalalignment='center')
plt.text(0, ViewMaxLength*1.0, 'Lengths={}'.format(LR_), fontsize = 14,horizontalalignment='center')
plt.text(0, -ViewMaxLength*1.6, 'Wangbw'.format(LR_), fontsize = 22,horizontalalignment='center')
dots = [ _[-1] for _ in Points]
dotsX = [0]
dotsY = [MoveYDown]
for x in dots:
dotsX.append(x[0])
dotsY.append(x[1]+MoveYDown)
ax.plot(lastX, lastY, linewidth=lineWidth[countPoints],color='w')
ax.plot(dotsX, dotsY,'-ow',marker='o',markerfacecolor='k', markersize=4,linewidth=1)
plt.savefig("imgaeNO56_1.png",dpi=1000)
plt.show()